Smart money: Nonsense, or something to pay attention to?

smar

Every now and then you come across a quote or a phrase that makes you roll your eyes.

In the working world I tend to find quotes such as ‘touch base’, ‘wait til the end of play’, ‘synergy’, and my least favourite, ‘singing from the same hymn sheet (it translates to ‘I want to passive aggressively make sure you do as I say)’ are all eye rollingly, teethgrindingly, fist clenchingly annoying.

In the world of markets, there are a few words and phrases that also get on my proverbials.

One is using ‘pips’ context of any asset other than FX.

The other is the term ‘smart money’.

Smart money.

Really think about it.

I could believe that it was created by someone always looking for an excuse.

For a reason to divide their reasons for losing into ‘not my fault’ and ‘not my fault’.

I’ve seen so many people talk about smart money in hindsight that I reckon we may have actually created a fault in time somewhere along the line.

Smart money is simply those investors who have more efficient means of coming to an investment decision, whether it’s based on time, money or more effective ways of entering the market.

That’s it.

It’s not some shady cabal of blokes sitting in a dark ex-monastery, plotting which way to send the markets next.

It’s simply those with access to information or the means to break information down and analyse it in a faster way.

And I think too many place too much emphasis on tracking smart money intraday. That money is not ‘smart’, that money is simply noise getting people offside short term. Probably mostly algos. But I don’t know enough about whether they are or not, neither could I care enough to delve into whether what their intraday aims are.

My focus this year and late last year has been to be building a thematic case based upon one or two key themes in the market and finding a corresponding asset class to execute in.

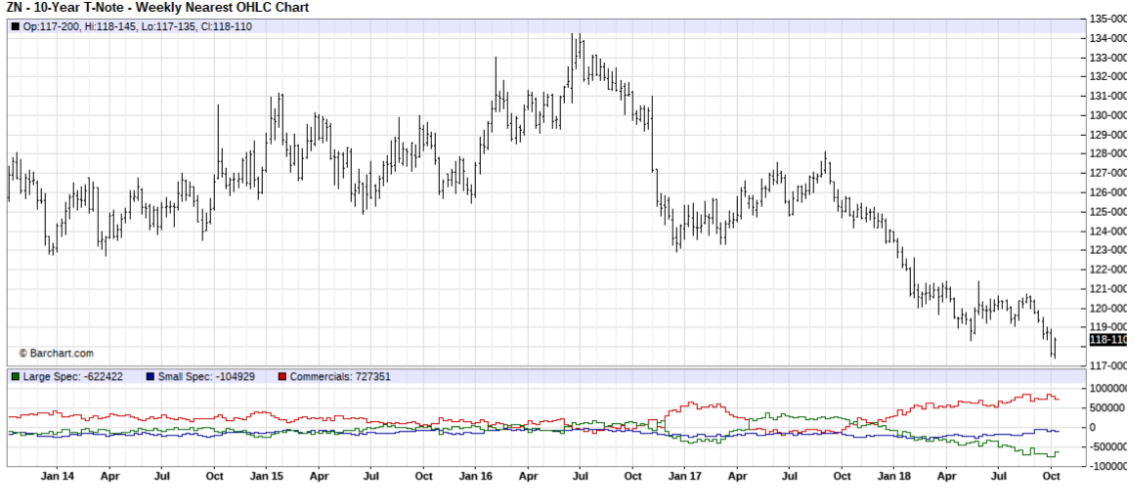
My post yesterday spoke about China and how they are facing some structural issues.

Since AUD is a proxy for China (AUD is correlated with Chinese aggregate demand) and JPY is bid when sentiment is risk off, it makes sense to be short AUD long JPY.

However, this pair is also a proxy for US equities since FX tends to be a more sensitive and leading indicator for intraday risk.

Cumulatively then, we can start adding other indicators in to measure whether our thesis is correct or not.

One of those is the Smart Money Flow Indicator.

This indicator is derived through the following equation:

Today’s SMI reading = yesterday’s SMI – opening gain or loss + last hour change

The reason the importance is put on the open and closing action is that covering occurs at the start of the day and more experienced investors/traders tend to trade during the end of the day since they have a more complete picture of the market.

But David, you’ve just said how you don’t like the term smart money?

Yes, well it wouldn’t be a half decent introduction without a Business Insider-like U-turn.

Bear with me.

Take a look at the SMI below.

smart1

What do you notice?

…apart from the large drop from 20k to the current index price?

Look at the support we have broken and correspond it with the years that the two supports were formed.

It should be glaringly obvious what happened at these two periods of 1999-2000 and 2007-2008.

If we take diagonal support levels as gospel then it would seem that we are in for a bit of a crap time since the smart money has now punctured through.

And there isn’t much distance between breaking the DotCom and GFC’s horizontal supports either.

There are some reasons that could be causing the fall other than smart money jumping out.

That could be due to limited retail demand while there is excessive corporate demand for equities due to buybacks – but you can’t trade stocks for buybacks in the last half hour of trading.

Longer term though, the data shows that a fall in the SMI precedes a stock market crash.

In my view, the fundamentals are aligned for another one – the question is always when?

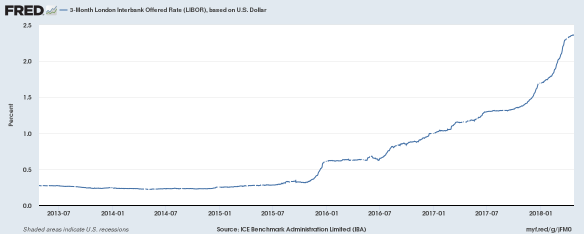
And in my view, that will be when the US has a real risk free rate of return again.smar


Why is Trump about to have a huge headache?

During the Great Leap Forward in Mao’s China, there was a plan introduced in order to kill four different pests (aptly and creatively called ‘The Four Pests Campaign’).

These four pests were rats, sparrows, mosquitoes and flies; they were to be eradicated to prevent the spread of disease and to stop the destroying of crops.

This was a huge failure.

Documentation shows that this was one of the largest reasons as to why the Great Famine occurred since the extermination of sparrows led to locusts massively increasing in population size as the food chain was disrupted.

This led to locusts destroying crops on a scale larger than the sparrows affected stored supplies of grains, corn and other soft agricultural food items.

The connotation here is a bit crude, I must admit, but one that has some pertinence: potentially well meaning policy to protect people can go entirely the wrong way.

QZ released an article on Friday explaining that Trump’s trade policy has had wildly the opposite effect of what the US president has expected it to have, with China hitting a record $34bn trade surplus with the US this month.

I’m not sure how well this will go down in Washington, with this being one of Trump’s leading policies – that is, if the policy was to less China’s surplus rather than affect demand for Chinese goods to the rest of the world. If the latter is the case, then the policy is actually going rather well since RoW Chinese exports have decreased while US exports have increased by a fair whack.

The quote from the article above speaks about there being a headwind to the Chinese economy – the slowdown in Chinese credit growth.

This may be the case, but I do not think that there is anything for the Chinese government to worry about just yet.

Take a look at the below chart.

This shows the 3M Shanghai Interbank Offered Rate. It’s the equivalent of LIBOR although less used on the international stage as a tool of pricing of some assets.

Something to notice is that China has been easing pretty stealthily since the start of 2018; this was when Trump put his first tariff on Chinese solar panel imports.

PBoC easing was absolutely a direct response to this.

You can see this from the USDCNH relationship too.

A cheaper Yuan pretty much counters Trump’s policy on Chinese trade since goods become relatively cheaper… the party is likely to be short lived for the PBoC though.

Something key that has always popped up is how China has been holding US treasuries for a long time and has dumped some…

But that is irrelevant in a world were the Fed are so adamantly shedding their own holdings of the US government’s debt, which is the main reason as to why yields have spiked and emerging markets have been under the cosh. It’s also relatively a pointless remark to make since if China dump them all then they have 0 leverage at all.

You only have to look at the positioning of traders on US treasuries to see that Fed rate rises are the reason as to why everyone and not just China have sat on the offer of US treasuries through 2018.

Late October 2017 is when we saw the temporary net long position (green line) start to turn long term net short.

This coincided with the Fed beginning their aggressive balance sheet shedding policy, and the USD liquidity issues that we see now.

The pertinence of this can be shown below.

That is 3m USD LIBOR. The upticks (monetary tightening) actually began in 2015 with the end of QE, but the effects on the dollar began later when the rate hike cycle began and increased in velocity when the Fed started to allow their bonds to mature. Naturally, this leads to the current uptick in yields – something which has affected the EMs hugely since they are laden with cheap USD denominated debt through the QE years.

Remember, LIBOR shows the cost of lending between each other and therefore, LIBOR can be a proxy for global liquidity and the corresponding creditworthiness of the interbank market (SOFR is too new a contract for me to have any thoughts on yet).

But back to China.

The LIBOR/SHIBOR spread is increasing, and this ultimately means that with the geo-politicking that is currently occurring we are likely going to face a tough reversal at some point where both parties find that they can no longer withstand the policies going either way (easing vs tightening). By then, Trump’s trade policy will be thrown in the dirt and will not matter one bit.

I see China going first – they cannot survive 305% debt to GDP. It’s untenable.

But so is the situation with USD.

Mehul Daya, an analyst who I think is absolutely bang on with the USD fundamentals, of Nedbank in South Africa reckons that the USD is about to face a collapse once a real risk free rate of return comes back… that is when r > CPI. He refersto it as ‘the straw that will break the camel’s back’.

However, I see it being made up of two factors – the first being that USD funding issues makes hedging too costly so assets are hedged in other currencies (I do not know which ones as I am not that smart) and the second being the issue Mehul raised.

This will lead to decompression of risk assets and a massive repricing/rebalancing of portfolio risk. This in turn will mean a collapse in US yields and therefore the dollar, probably to levels seen when we began QE in 09.

So does Trump have a headache?

Yes, but the answer is much closer to home for him, and that is with the hawkishness of Jerome Powell.

As we know, last week Trump has a bit of a dig at Powell since he knows that Fed tightening is at odds with his China trade policy. I personally think that Trump knows the Fed has created this illusion of a strong economy.

Zombie companies have not gone under since their operational costs are kept low through cheap credit and low (but now rising) financial costs and so unemployment stays low… but so does investment.

This is a surefire reason as to why Trump is so averse to Fed hiking, and is (again in my view) the real reason why he may need something a bit stronger than paracetamol for the inevitable migraine he is going to face.

I’m sure politicians were once bright eyed…

A thought came to me just now as to why politicians are so lame.

Pretty scathing, but it is true. For so long we’ve had politicians that promise change and then end up being the same as the last.

I mean, the modern day Tory Party is basically New Labour.

Why do they seem to converge to the middle?

They play a game is the simple answer.

You’re always going to have your lifelong voters, but to win at politics, you need those swing voters.

I could be talking absolute nonsense here, but at least it gives something to think about…

Image result for two bell curves overlapping

This is what I imagine occurs.

Consider B as being the swing voter area – I think most people if they could would rather vote for themselves, but there’s relative bipartisanship when it comes to voting outcomes these days, more so in the US.

Then consider the individual standard distributions when the party is in power.

There is the acquisition side of politics, and then there’s the retentive side – the tails towards the middle on the individual curves have to cater to those who are only supporting on a ‘lesser of two evils’ basis.

Whoever wins B wins the election. Just that little area wins it for either the left or the right.

The problem? Policies have to appease these people who are politically indifferent.

This means that policies are always going to reverting towards the mean, or in other words, they’re never really going to be that different from what occurred before.

Generally… I’m not sure I’d apply the same logic to John McDonnell…

This was just an example that I thought of but there are many more.

In trading, many algorithms are based on price reverting to the mean whereby you take a sample of price data and apply buy or sell orders on 1/2 standard deviations from the R^2 of the sample or another benchmark that measures deviation from the mean such as velocity or maybe even volume changes relative to the rest of the sample.

In sales, if you have a big sample, it’s unlikely that you will consistently go long periods of making no sales without a statistical correction happening, as long as you are using the same methods as previously – yes there are external variables but generally there shouldn’t be long term deviation of a massive magnitude (unless the market really changes).

In terms of politics, I guess a change in political party in power shows an example of tail risk, since those at the outer edges of the left and right bell curves are those affecting the change more drastically.

In portfolio management, that’s when a movement of more than 3 standard deviations occurs, which is pretty rare, but has HUGE implications (and which is occurring more and more often).


I guess it depends on what the distribution of swing voters are relative to the effect that they can cause is, or in other words, how disenfranchised they are with the current political climate.

Can the Trump and Brexit votes be explained this way?

I think possibly if we consider the elements that go towards creating the desire to want change – in other words, how tail risk is created.

To avoid this tail risk, politicians avoid the outer edges and win by appeasing the majority, reflected in the bell curve distribution… but tail risk in the current environment is always underpriced it seems since multi-standard deviation moves shouldn’t be occurring as much as they are of recent times


OK I’m A Dollar Bull Now…

Just seeing one chart has changed my bias on the dollar totally by allowing a confirmation of a few fundamental concepts.

I have to really thank CNBC’s Todd Gordon for this one.

I read his article and noticed that he is using a different USD gauge.

I generally look at the dollar index as a function of equal weights.

However, just by looking at a more-applicable-to-reality trade weighted dollar, it has generated new thoughts and perspective on my macroeconomic view, as well as currency risk view.

Take a look at the TW dollar…

We have indeed breached a 30 year trendline and have found some support here at just below 85.00.

I’m not saying that we are going to rally off from here into 110, since I think we are still due a dip down to 75, but my very long term view is now bullish.

This is supported by various different other background events.

Let’s look at the 10 year yield.

This is following the same path as the trade weighted dollar (naturally).

With the Fed unwinding, I think that a situation such as in 1994 will occur again.

Bonds sold off in 1994 and yields rallied by 46%.

If yields move to where I think they will, that would be a 75% move from current price.

Why are yields moving up? The Fed is shedding assets from their balance sheet after having undergone the fantastically functional QE programme of the last 9 years (sarcasm).

See below. I have added 3M USD LIBOR onto here as well.

fredgraph (1)

You can see that when the Fed underwent their QE programme, USD 3M LIBOR fell a huge amount. This meant that USD was very liquid and interbank borrowing costs were low. Basically, everything was nice and liquid.

Since the Fed has started hiking in late 2016, 3M USD LIBOR started pushing up. Markets knew that this was in preparation for the Fed to start their great unwind. You can see this in the gradual decay in assets owned by the Fed (blue line) since 2016, with a slight acceleration in late 2017 when they announced fully that they will be shedding their ‘assets’.

But what does this mean for the dollar?

Well, a rising LIBOR should indicate dollar demand/supply constriction.

Take a look at this chart.

3M USD LIBOR is lagging spot USD by a large amount.

If we go back to our yield and dollar index charts, we can see that a broad upside move is not that crazy an idea if it holds that we are going to face a dollar funding problem. This dollar funding issue also leads to another problem and that is to do with liquidity.

We’ve already seen some flutters in the TEDRate, an indicator of liquidity risk.

When the Fed announced their unwinding, we saw a gradual rise in the Ted Rate which led to the highest level since 2009. Essentially, this priced in that liquidity risk was higher than the European debt crisis in 2012.

This indicator shows the credit worthiness of our biggest banks – LIBOR is the price that they lend to each other on the interbank market. A spike in the TEDRate means there is more ‘risk’ on the interbank loans market. That is not good.

The Bank Index has probably reflected this occurrence.

The drop off in price from the run up to the 2008 high could have some meaning in this case, especially since before the 2008 crisis we faced USD funding cost issues as well.

USD 3M LIBOR moved up pretty rapidly pre crisis then… it’s exhibiting the same characteristics now.

fredgraph (2)

Essentially, I feel the dollar is currently heavily under priced if we follow the underlying money market fundamentals. I think that there is some downside left and the current move is a short squeeze, but there will be a more broad based dollar upside move in the next year to 18 months, and much of it will be driven by dollar funding issues.


Absolute rubbish…


Sometimes you just have to accept that you are going to be really silly and maybe just not follow your plan.

Yesterday that was me, and I ended up down 3% on account.

The first thing that went wrong was that I actively wanted to do business on ECB day.

I never do that, and the select few times that I have, I’ve been spanked, with one exception.

The second issue I ran into was buying the Euro thinking it would shift to the upside quickly due to there being a build up of stops. See here:

Price did run them, but I should have used this as a sign that the move would be fuelled to the downside, the reason being is evidenced here:

Trying to buy the Euro at an area of key support with a volatile ECB presser, with market flow being to the downside are you, David?

Bellend.

The third problem with yesterday was that I really didn’t even follow my longer term view for the Euro… which I had posted the night before.

https://twitter.com/david__belle/status/989223413632905216

I’m honestly laughing to myself now, because I feel like a total tool and I shall not be making this mistake again… what’s worse is that I had never been this unbelievably stupid before.

However, my saving grace is that I have a 3% limit on the day and a 5% limit on the week.

If I lose 3% in one day, I go away, don’t look at a chart for a day, then come back and see what I’ve done wrong the next day, as I’m doing now.

If I lose 5% then I simply come back the next week. I don’t even bother looking at what I did wrong that week because there was clearly something up and so I wouldn’t be able to analyse my own behaviour properly.

Now I know what I’m doing next week on the Euro, but I also know what I’m doing on  AUDJPY next week now too.

Here’s my plan on AUDJPY:

Stop is above 84, target at 80.75 with a sell above 83.10, depending on how price behaves.

If it does extend higher then I’ll divide my positions between 83.10 and 84.00, but ideally, I just want to sell into a peak above 83.10.

I wanted to write this post more for a cathartic reason – I don’t mind losing, but when I’ve done it in such a stupid and more worryingly, rather careless way, it gets to me.


Making long term bets: Cable to $2

Sometimes I like to have absurd predictions.

I find that by looking at a long term chart, you can build a macro reasoning around a trade idea.

It doesn’t have to be right, but it has to have validity at least and you have to be open to changing your beliefs.

I think in the next few years, we will return to cheap holidays in the US, where £1 = $2.

Here’s a 6 month chart of cable.

Looks like a head is forming.

I’d argue that a mid term hold of 1.45 and you could hold GBP and keep adding to a very long term position.

This would put British firms who deal in USD in a tight position, since you’d really have to be hedging the dollar downside heavily, although that will be perfect for FX desks looking to make budget.

This could also be reliant on a Euro collapse.

I always note that fundamental moves have to be unwound, and you can see these in the charts.

Just like how the dollar move is currently being unwound (when the Fed stopped balance sheet increases, the dollar rallied through 2014), a failure of the Euro could mean that the EURGBP position is unwound – and that can also be seen in cable.

Take a look.

Cable

EURGBP

When I refer to Euro being introduced, I mean that in 2002, this is when it was introduced as legal tended to the initial 12 countries (banknotes and coins).

This has a vastly different usage to simply being currency, since it is now connected heavily to economic activity of consumers.

This is what has changed.

Back in 2002, no one knew what monetary union would bring (well, they did, but consumers and the EU didn’t).

They didn’t know that it would bring high amounts of unemployment, huge deficits, some nations benefiting more than others, countries requiring bailouts, 5% of loans in the Euro area being non performing, Deutsche Bank holding $75tn of gross exposure to derivatives and the ECB balance sheet being the highest in the world.

They didn’t expect cheap money being the only thing to be propping up large firms.

They didn’t expect a lot of these issues that have arisen.

Yet here we are with Draghi inflating the ECB balance sheet continually.

How is he going to unwind?

Well, he won’t be able to – not at the rates currently; who will be the buyer?

So he’s in a predicament.

This is the main reason as to why I do not think the Eurozone will last. There is inevitably going to be a liquidity crisis when it comes to wanting to get rid of these bonds.

Is China going to be the country to buy EZ bonds? Not with their epic debt issues.

I think confidence will be lost, gradually.

Even as recently as yesterday, the German ZEW Economic Survey had a huge miss, and EZ data hasn’t been fantastic this quarter.

The ECB, by trying to provide liquidity to the market, are actually creating a huge liquidity issue.

Back to the trade though.

The logic is pretty simple.

If we see the Eurozone start to fracture, accumulating longs above $1.45 would be a good idea. Even buy a Sterling ETF like FXB if you don’t want to be sitting managing it. See below:

I think a combination of high dollar funding costs, of which I referred to a few years ago here in relation to oil, Trump’s trade war with China and the Fed’s unwinding are going to keep the dollar suppressed for the foreseeable future.

On sterling side, I think Brexit is going to be a catalyst for growth.

With the service sector infrastructure we have, removing ourselves from EU regulations, especially in finance, should create a more competitive environment – everyone wants an FCA & PRU licence, very few care about being regulated by EU local regulatory bodies.

If the Euro were to go, it would mean that EU financial regulators would also go – because of the above reason, and London’s name as being the world’s biggest financial hub, I’d expect this to be hugely GBP bullish (no sarcastic comments about being a typical Leave voter, please).

There is no timeline for this, since that would mean I would have a crystal ball.

But any fracturing that is apparent will solidify this as a decent bet.


Is the FTSE dead?

I’m concerned.

The below chart of the FTSE does not look healthy to me.

We are currently facing a lot of downside pressures, with the FTSE breaking below 7000 and pushing back up twice in the last few weeks.

This gradual probing is worrying and it’s not really being spoken about too much.

Let’s face it, we’re currently off the highs up at 7800 by 800 points. This has been a gradual grind down over the past few weeks.

Why? Well I have one main reason.

The Fed is unwinding their balance sheet.

We have to remember that a huge amount of the FTSE is denominated in USD, since many sales are done in the greenback.

This therefore has a direct correlation with Fed tightening monetary conditions – one component of that is shedding the huge $4.2tn balance sheet that they have acquired over the last 9 years through quantitative easing.

No more will firms be able to stay afloat by cheap credit.

No more will retail investors be able to hold as cheap margin positions on US equities, and more specifically, products such as $SPY, an ETF that tracks the SP500.

The former has a direct effect on the financial fundamentals of a firm.

If a firm’s price has been propped up for 9 years trough cheap credit, buybacks and corporate bond purchases by the central bank, and these are all of a sudden removed, investors will see this as a negative price effect.

This has a knock on effect on FTSE firms, not only purely from an investor standpoint, but the BoE tends to follow the Fed’s Mon Pol signalling.

The overarching mechanism here is something known as equity risk premium compression – there has barely been an attractive risk free rate for such a long time, that investors have been looking for yield as if they are jacked up on testosterone.

Here is a chart showing this.

What is hugely dangerous about this current market cycle is that only 9% of the price increase of the SP500 on the past bull market is due to earnings growth.

The majority of this cycle has been caused simply by low rates.

And now that rates are increasing, I see the most violent move to the downside that we have ever seen occurring when the Fed, and consequently the BoE, begin to really shed the assets off their books.

In fact, I believe that the Fed are only increasing rates to accommodate when another crisis hits.

It is easier in terms of economic confidence, to lower from $4tn to $2tn than to increase balance sheet holding to $5/6tn when the inevitable occurs.

I drew up the below chart a few months ago of the USD.

And this is the chart now.

The Fed has been hiking, which should mean a bullish dollar.

But the dollar has been falling.

For me, this signifies a lack of confidence in the US economy, where we are reversing the 2014 move I.e the end of the balance sheet increases.

I’m not advising to do anything, but if I look at the probabilities and where the easiest money will be, I’d be looking to get short on the FTSE (or long GBPUSD as an easier trade, although with that method you’re more susceptible to price shocks).

Why Warren Buffett is wrong

Please see alternative non clickbait title: ‘Why the media’s interpretation of Warren Buffett’s claim that ‘low cost index funds are better than actively managed funds’ is wrong… I wouldn’t get as many clicks that way though.

Yes, I am shameless.

That is quite a statement.

I do not claim to know more than Buffet, obviously.

But the way the media have taken a statement and run with it is ridiculous.

Take a look at this article for a recap.

Buffett made a bet with Protegé Partners that buying a low cost SP500 tracker ETF from 2007 til 2016 would return more than the fund of funds that Protegé bought.

I don’t actually believe that anyone would argue that long term, SP500 trackers are the best investment…

And the stakes that they were playing at in relation to their total managed capital was so small; they initially bet $320k which then you have to question their convictions over this.

But what financial journo’s have seemingly forgotten is the motivations for investing in both and the client types that use both vehicles.

Hedgefunds are totally different to passive trackers for many reasons.

The ‘hedge’ part of the word indicates some kind of risk management or risk aversion.

Hedgefund managers want their strategy to be as uncorrelated to traditional market benchmarks as possible.

In this way, they are able to provide more consistent returns with less drawdown than you may receive where you simply invest in an index.

The returns are more bond-like where it may not beat an index benchmark, but it beats an agreed benchmark set by the fund manager in the prospectus provided before an investor comes on board.

Do you not think that all hedgefund investors would be pulling their money out if they wanted to simply buy $SPY or chuck a load of cash at other passive index funds?

The dishonesty that many outlets push with this is crazy.

Sure, a low cost index tracker is fantastic for non accredited investors and possibly as part of a wider portfolio, but when you have $100m, you certainly do not want your cash following the herd.

What if a downturn occurred?

Would there be sufficient liquidity to pull $100m out of the market?

Many live off the interest – people with a lot of money aren’t exactly saving for retirement.

If you have $100m and you’re making 6% a year net of fees (underperforming the broader market) that’s $6m for doing nothing.

The financial media, once again, has ignored specifics of the three W’s – ‘who, what, why?’

Zero nuance.

But hey, pushing money towards Vanguard is always great right?

Why do brokers provide technical analysis?


hf

Honestly, have you ever looked at a piece of technical analysis that a broker has emailed to you?

Emails starting with ‘Technical Levels for 16/03/2018’.

Why do you send these things, but then promote in education that you should follow your own strategy and do your own research?

Oh, and why do brokers expect clients to follow their analysis when they’re probably trading against them?

It’s bizarre, but probably due to a little thing called SEO, something which I’m learning about in this blog.

In my view, market analysts are little more than content marketers.

And that’s absolutely OK.

Even at banks, analysts producing reports are just one cog in the commissions machine – investors want to feel secure in the notion that the people handling their cash know what they’re doing (although, if they just bought $SPY and held for 10 years, they’d probably earn more).

I guess that if a retail client from a brokerage receives something that looks good, there’s a subconscious feeling of security, even though total autonomy with execution is with them…

The broker is just there to collect fees.

At the end of the day, most revenue is derived from fees (example is from advising on M&A but you get the picture).

That ‘2 and 20’ structure, where a hedge fund takes 2% of AUM and 20% of any profit earned has worked well for many years.

The 2% has been explained to me as a manager’s bread and butter, while the 20% is just a bonus – I mean, it’s probably why Bill Ackerman isn’t crying his eyes out after losing out on Valeant and Herbalife.

Some investors have been questioning this model for a while now…

And Mr. Buffet’s famous bet would add fuel to their argument…

Back to the brokers…

It’s not a criticism of why they do it, but I just wonder whether it’s actually worth it in the end when they’re likely to collect the fee or profit off the B Book anyway, since the stats even out to 80:20 loss:win with any types of marketing strategies anyway.